
Debug, profile, and view logs for your Worker in Chrome Devtools — now supported in the Cloudflare Vite plugin
You can now debug, profile, view logs, and analyze memory usage for your Worker ↗ using Chrome Devtools ↗ when your Worker runs locally using the Cloudflare Vite plugin ↗.
Previously, this was only possible if your Worker ran locally using the Wrangler CLI ↗, and now you can do all the same things if your Worker uses Vite ↗.
When you run vite, you'll now see a debug URL in your console:
VITE v6.3.5 ready in 461 ms
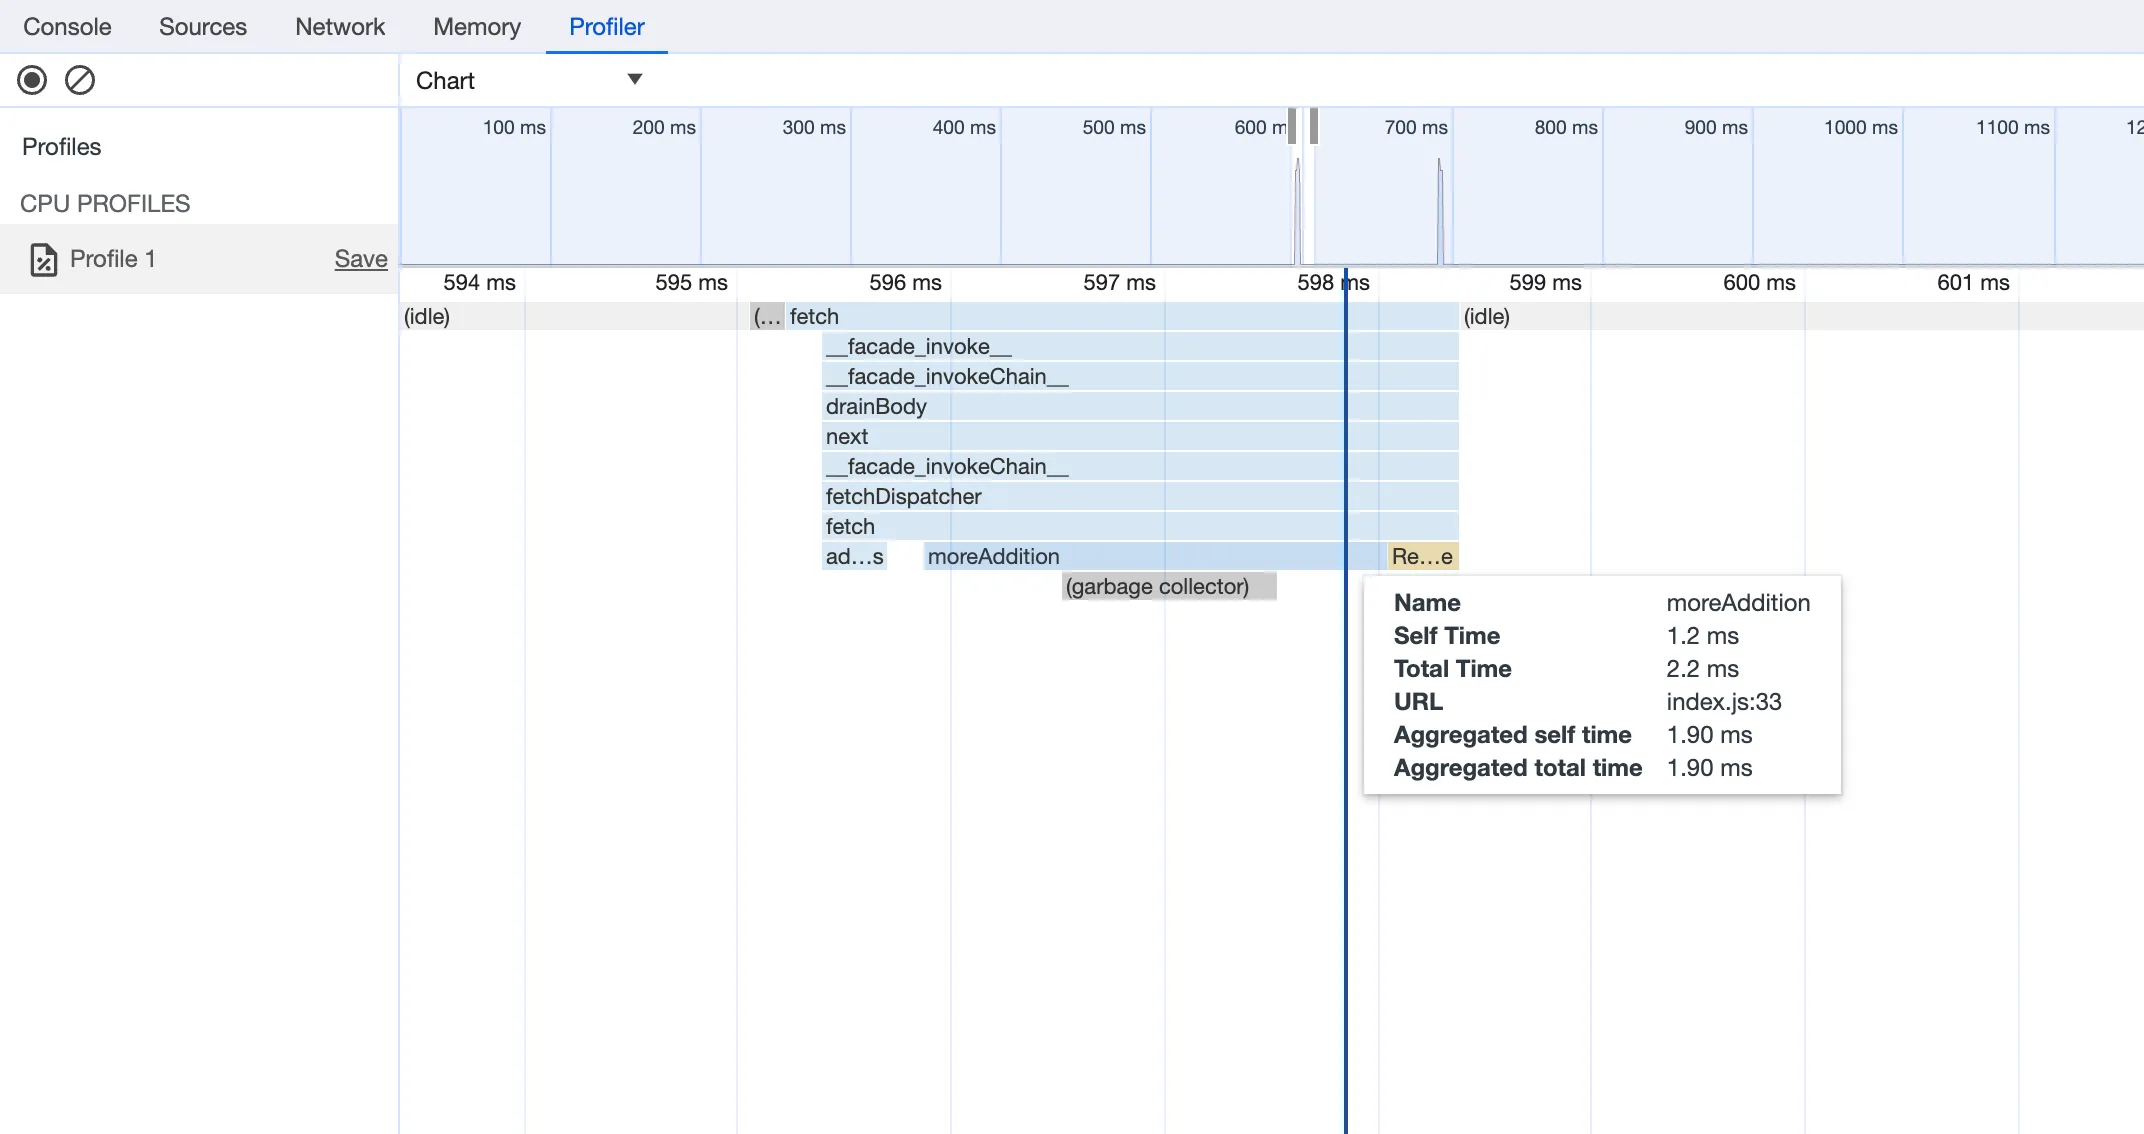
➜ Local: http://localhost:5173/ ➜ Network: use --host to expose ➜ Debug: http://localhost:5173/__debug ➜ press h + enter to show helpOpen the URL in Chrome, and an instance of Chrome Devtools will open and connect to your Worker running locally. You can then use Chrome Devtools to debug and introspect performance issues. For example, you can navigate to the Performance tab to understand where CPU time is spent in your Worker:
For more information on how to get the most out of Chrome Devtools, refer to the following docs:
Was this helpful?
- Resources
- API
- New to Cloudflare?
- Products
- Sponsorships
- Open Source
- Support
- Help Center
- System Status
- Compliance
- GDPR
- Company
- cloudflare.com
- Our team
- Careers
- 2025 Cloudflare, Inc.
- Privacy Policy
- Terms of Use
- Report Security Issues
- Trademark